Creating an observability platform for a multi-site parking facility
The Challenge
Higher education institutions that have to manage a portfolio of multi-use parking facilities tend to struggle with analysing how different locations are used. Some car parks can be for students only, some for staff only, some for visitors only, and some can be a mixture of these three types of driver.
In this case, the customer was a university that had a plethora of mixed used car parks. They were seeing a lot of complaints about the parking situation - ranging from there not being enough permits available for allocation, drivers not being able to find a parking space without having to drive to each car park, and campus security staff finding it difficult to identify suspicious vehicles or activity.
Pain Points 💢
- No existing platform to consume data and gain insights
- Manual issuing of car park permits
- No way of spotting unusual or suspect vehicles/activity.
The Solution
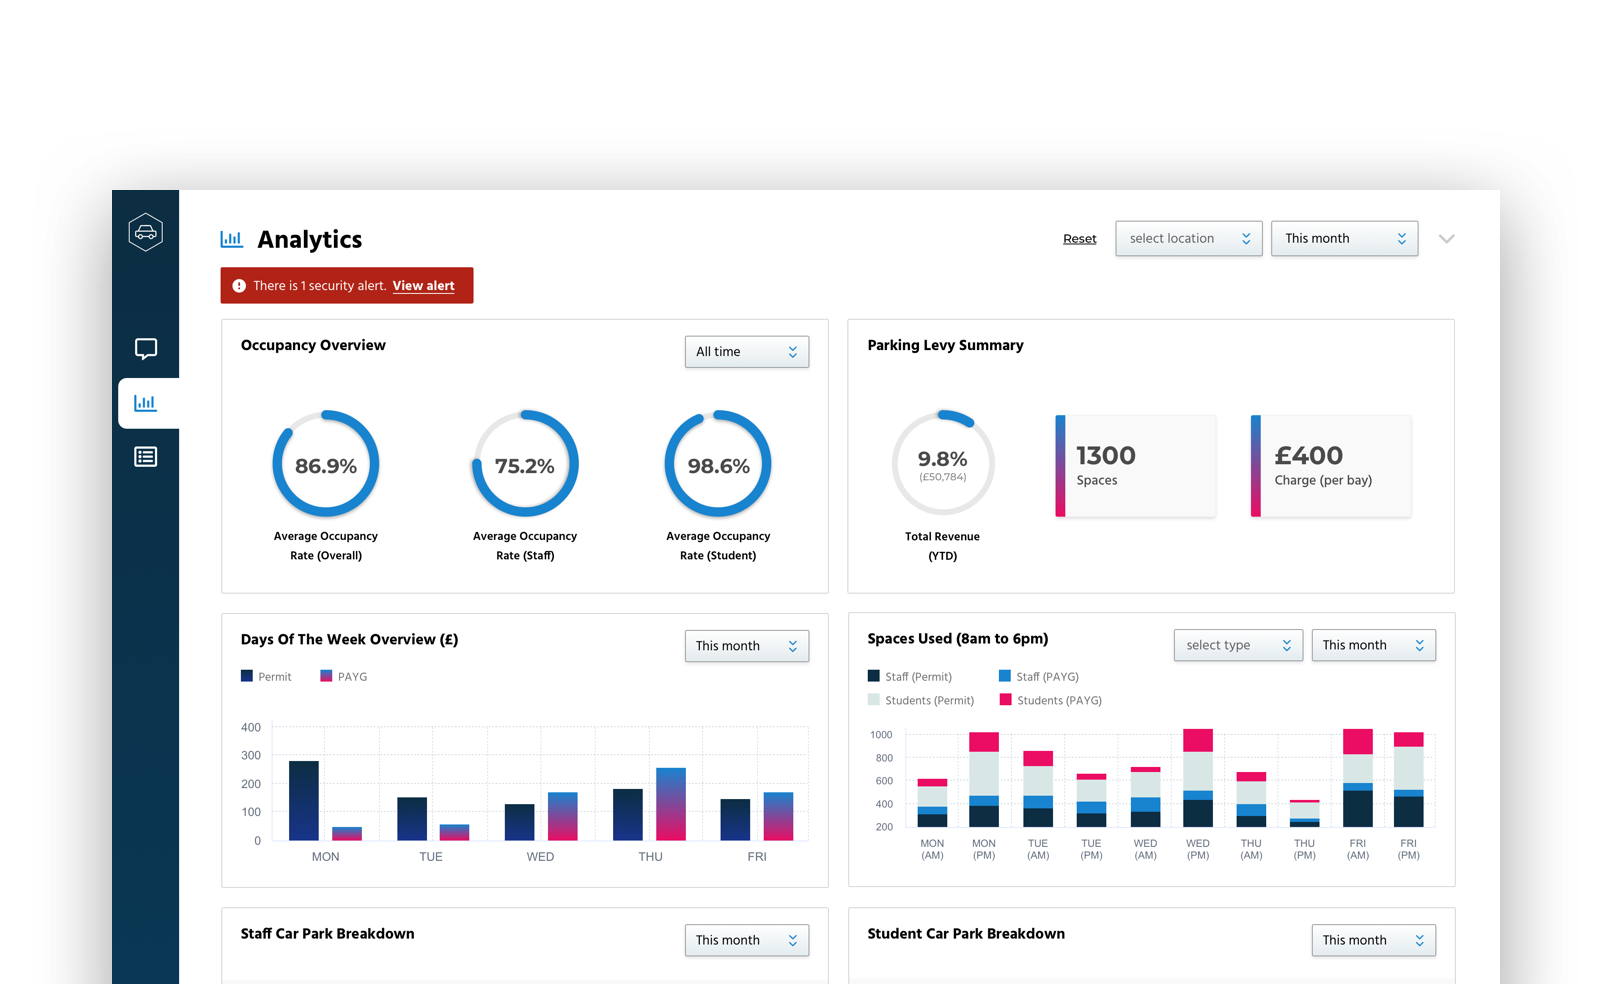
Using PowerBI to ingest and display data such as ANPR information, occupancy rates, and space utilisation during the week for all the car parks, I created an analytics dashboard where the customer could easily access an overview of how their car parks were being utilised. This would enable the customer to be able to manage the amount of student and staff permits, and assist with directing visitors to available spaces.
An alert notification system that leveraged the number plate recognition system to log unusual activity, such as cars entering campus car parks late in the night, was included to assist campus security. Alerts could be viewed at any time and staff could either choose to keep it on record or take appropriate action.
The ANPR data would also be used in issuing digital permits i.e. a car with a valid permit would be able to pass through the barrier at any one of their ANPR camera sites rather than having to be manually checked.
The Outcome
Capacity and permits were expected to be at least 25% better managed as a result of this solution and complaints were expected to reduce by 50%.
Key features of the solution:
- Leverage Power BI to parse and display data
- Overview of utilisation of each site, including busiest locations for better management of permits
- Improved monitoring of all visitors and ability to identify suspect vehicles in a timely manner
